
Email: info@shhejochemicals.com
Phone: + 86 21 6417 1223 / +86 152 167 18324
Address: 910. 9th Floor, No.99 South Longshui Road, Xuhui District, Shanghai, China 200232
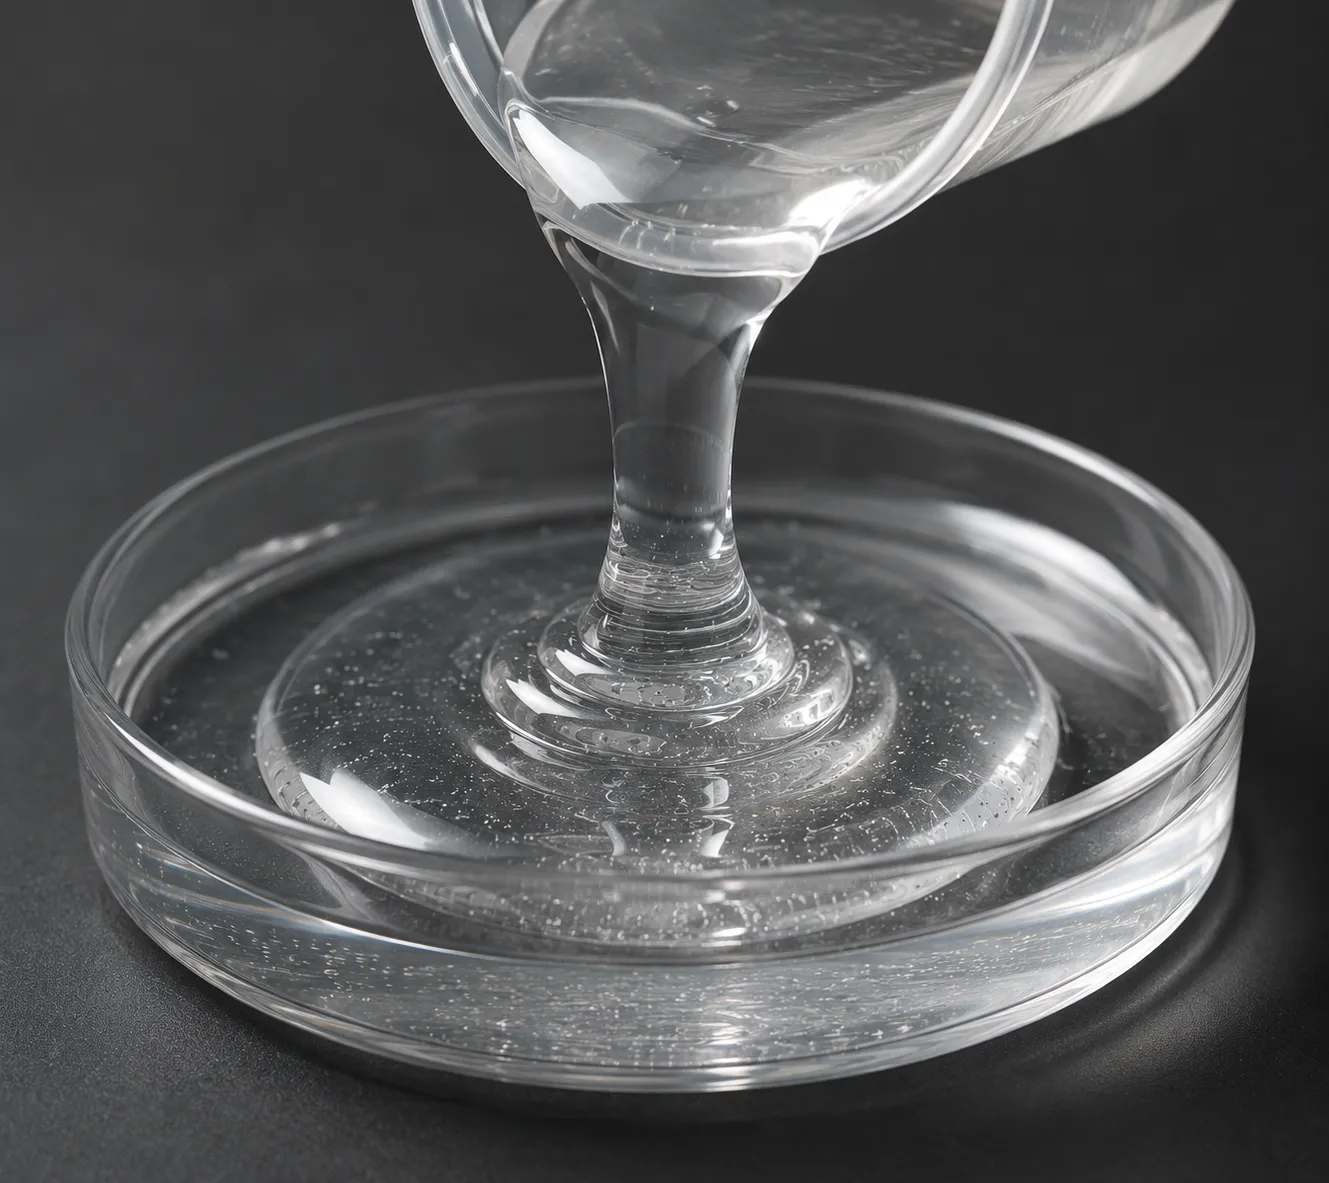
For engineers and technicians working with advanced composite materials, mastering high-temperature resin processing is both a rigorous science and an art. The key to unlocking defect-free, high-performance composites lies in understanding the resin's rheological behavior—specifically, deciphering the viscosity curve. While the data points generated by a rheometer might look like an intimidating, steep spike on a graph, the underlying chemistry can be easily understood through a relatable culinary analogy: boiling sugar for candy. Just as sugar syrup transforms under heat from a thin liquid to a sticky gel and finally into a hard, brittle glass, thermosetting resins undergo a very similar chemical journey. By mapping the phases of candy making to the viscosity curve, manufacturers can intuitively understand when a resin will flow, when it will gel, and when it will finally lock into its permanent structural form.
When you apply heat to a high-temperature resin system, such as an aerospace-grade epoxy or bismaleimide (BMI), the initial thermal energy causes the molecular chains to relax, resulting in a rapid drop in viscosity. On a viscosity curve, this initial plunge represents the "thin syrup" stage. The lowest point on this graph is the minimum viscosity—the critical "sweet spot" where the resin flows most freely. In composite manufacturing, this is the exact process window when the resin can perfectly wet out the dry reinforcement fibers, filling every microscopic cavity. However, as the temperature continues to rise or time elapses, the curing reaction accelerates. The polymer chains begin to cross-link, building a complex, three-dimensional network. This triggers the Gel Point, akin to the "soft ball" or "firm ball" stage in sugar boiling. On the curve, this is visually represented by a sudden, exponential vertical spike in viscosity. The resin transitions from a processable liquid into a rubbery, unworkable solid; if consolidation pressure in the autoclave hasn't been properly applied before this vertical climb, the final composite part will inevitably be plagued with structural voids and dry spots.
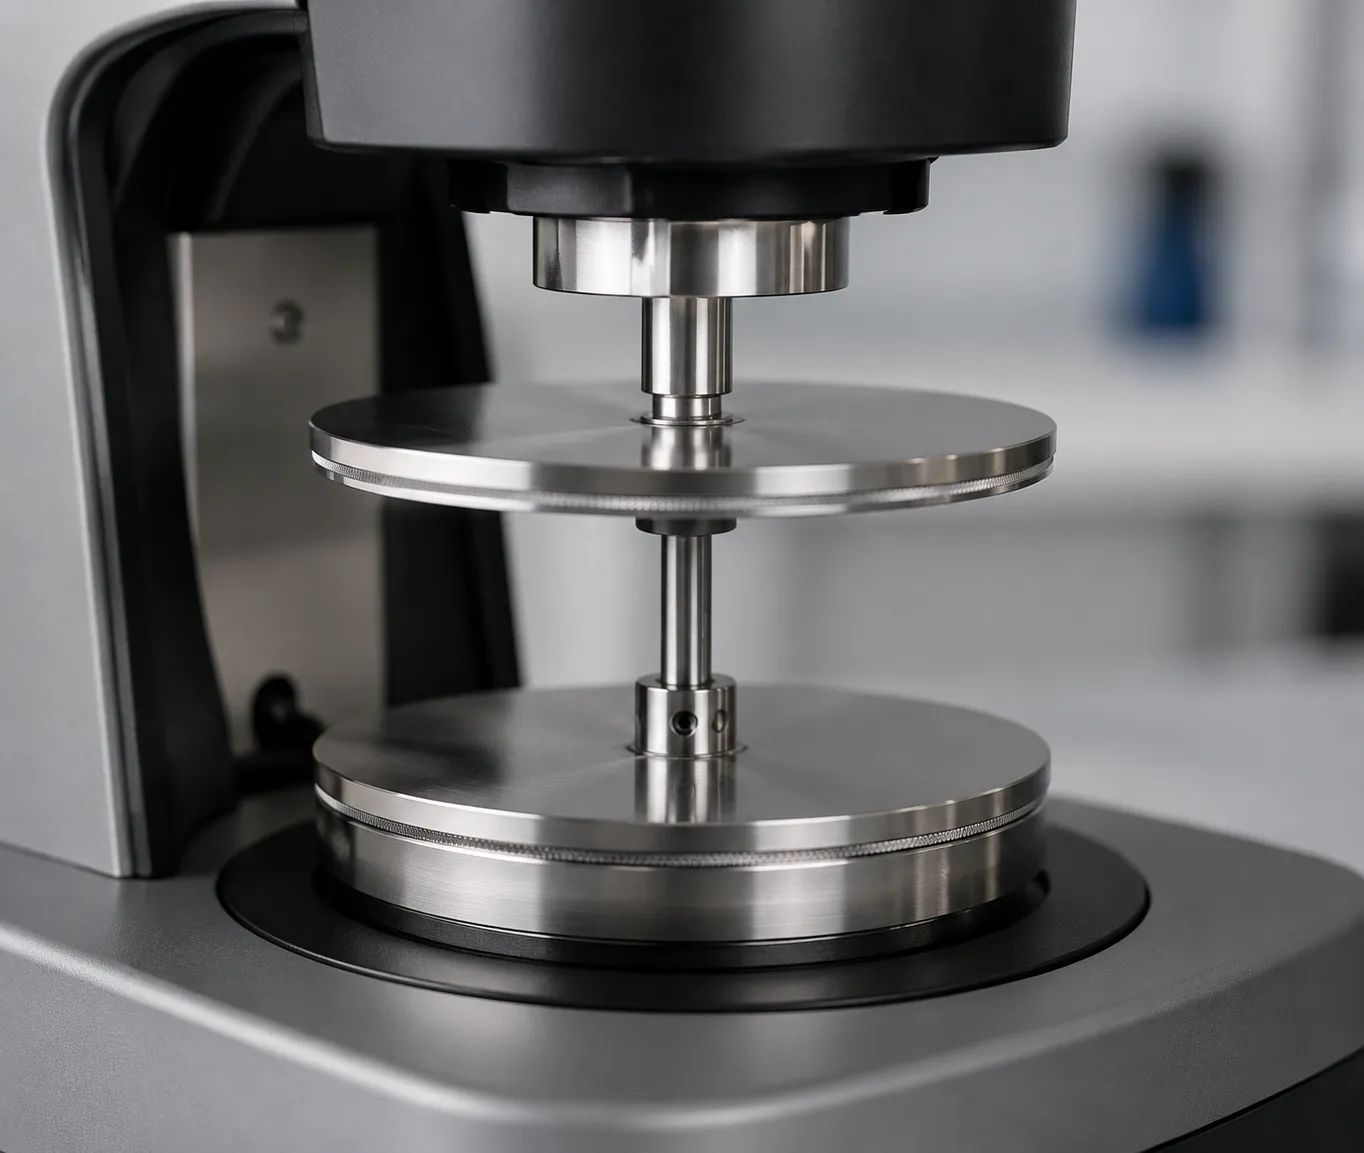
Validating this precise time-temperature-viscosity relationship is a mandatory step in aerospace, automotive, and industrial manufacturing. Engineers cannot rely on guesswork; they use sophisticated instruments like parallel-plate rheometers to plot the exact trajectory of the resin's viscosity under simulated production conditions. As the cross-linking reaction proceeds past the gel point, the resin eventually undergoes Vitrification—the equivalent of the "hard crack" stage in candy making, where the material becomes a glassy, rigid solid, and the viscosity curve plateaus at its absolute maximum. By meticulously studying these viscosity curves, process engineers can design the perfect cure cycle, determining the exact heating ramp rates, dwell times, and pressure application windows required for a flawless part. Just as a master confectioner relies on a candy thermometer to trap sugar at the perfect structural stage, materials engineers rely on validated viscosity curves to turn raw polymers into next-generation engineering marvels.
For engineers and technicians working with advanced composite materials, mastering high-temperature resin processing is both a rigorous science and an art. The key to unlocking defect-free, high-performance composites lies in understanding the resin's rheological behavior—specifically, deciphering the viscosity curve. While the data points generated by a rheometer might look like an intimidating, steep spike on a graph, the underlying chemistry can be easily understood through a relatable culinary analogy: boiling sugar for candy. Just as sugar syrup transforms under heat from a thin liquid to a sticky gel and finally into a hard, brittle glass, thermosetting resins undergo a very similar chemical journey. By mapping the phases of candy making to the viscosity curve, manufacturers can intuitively understand when a resin will flow, when it will gel, and when it will finally lock into its permanent structural form.
When you apply heat to a high-temperature resin system, such as an aerospace-grade epoxy or bismaleimide (BMI), the initial thermal energy causes the molecular chains to relax, resulting in a rapid drop in viscosity. On a viscosity curve, this initial plunge represents the "thin syrup" stage. The lowest point on this graph is the minimum viscosity—the critical "sweet spot" where the resin flows most freely. In composite manufacturing, this is the exact process window when the resin can perfectly wet out the dry reinforcement fibers, filling every microscopic cavity. However, as the temperature continues to rise or time elapses, the curing reaction accelerates. The polymer chains begin to cross-link, building a complex, three-dimensional network. This triggers the Gel Point, akin to the "soft ball" or "firm ball" stage in sugar boiling. On the curve, this is visually represented by a sudden, exponential vertical spike in viscosity. The resin transitions from a processable liquid into a rubbery, unworkable solid; if consolidation pressure in the autoclave hasn't been properly applied before this vertical climb, the final composite part will inevitably be plagued with structural voids and dry spots.
Validating this precise time-temperature-viscosity relationship is a mandatory step in aerospace, automotive, and industrial manufacturing. Engineers cannot rely on guesswork; they use sophisticated instruments like parallel-plate rheometers to plot the exact trajectory of the resin's viscosity under simulated production conditions. As the cross-linking reaction proceeds past the gel point, the resin eventually undergoes Vitrification—the equivalent of the "hard crack" stage in candy making, where the material becomes a glassy, rigid solid, and the viscosity curve plateaus at its absolute maximum. By meticulously studying these viscosity curves, process engineers can design the perfect cure cycle, determining the exact heating ramp rates, dwell times, and pressure application windows required for a flawless part. Just as a master confectioner relies on a candy thermometer to trap sugar at the perfect structural stage, materials engineers rely on validated viscosity curves to turn raw polymers into next-generation engineering marvels.
Email: info@shhejochemicals.com
Phone: + 86 21 6417 1223 / +86 152 167 18324
Address: 910. 9th Floor, No.99 South Longshui Road, Xuhui District, Shanghai, China 200232
Copyright © 2025 Shanghai Hejo Chemicals Ltd. Powered by iglobalwin.com